A short while ago a friend of mine suggested I watch Vsauces video on Zipf’s law, Pareto’s principle and their mysterious appearances all around us. Here is a little teaser to gain your attention – 80% of all people live in 20% of most popular cities; 80% of all land belongs to 20% of wealthiest landlords; 80% of all trash is on the top 20% trashiest streets – as predicted by Zipf’s law and Paretos principle.
Not enough? Well, as I discovered yesterday, the rabbit hole does not stop there… Full of scepticism, I decided to look at how much time people spend playing Steam games… Well. 80% of people’s time is spent playing 20% of the most popular games… Interesting? Well, read on, there is more to this story.
Clocking in at over 20min, Vsauces endeavor is awesome and explains a lot of the big picture stuff about Zipf, however he is very shy at showing us the core mechanism that is widely believed to contribute to why Zipf works how it does. So before we go on I would like to briefly explain that.
Zipf’s law explained
There are several conceptual ways to explain the intuition behind the 20/80 principle. The best example, in my opinion, is the one about Moon craters.
Basic experiment
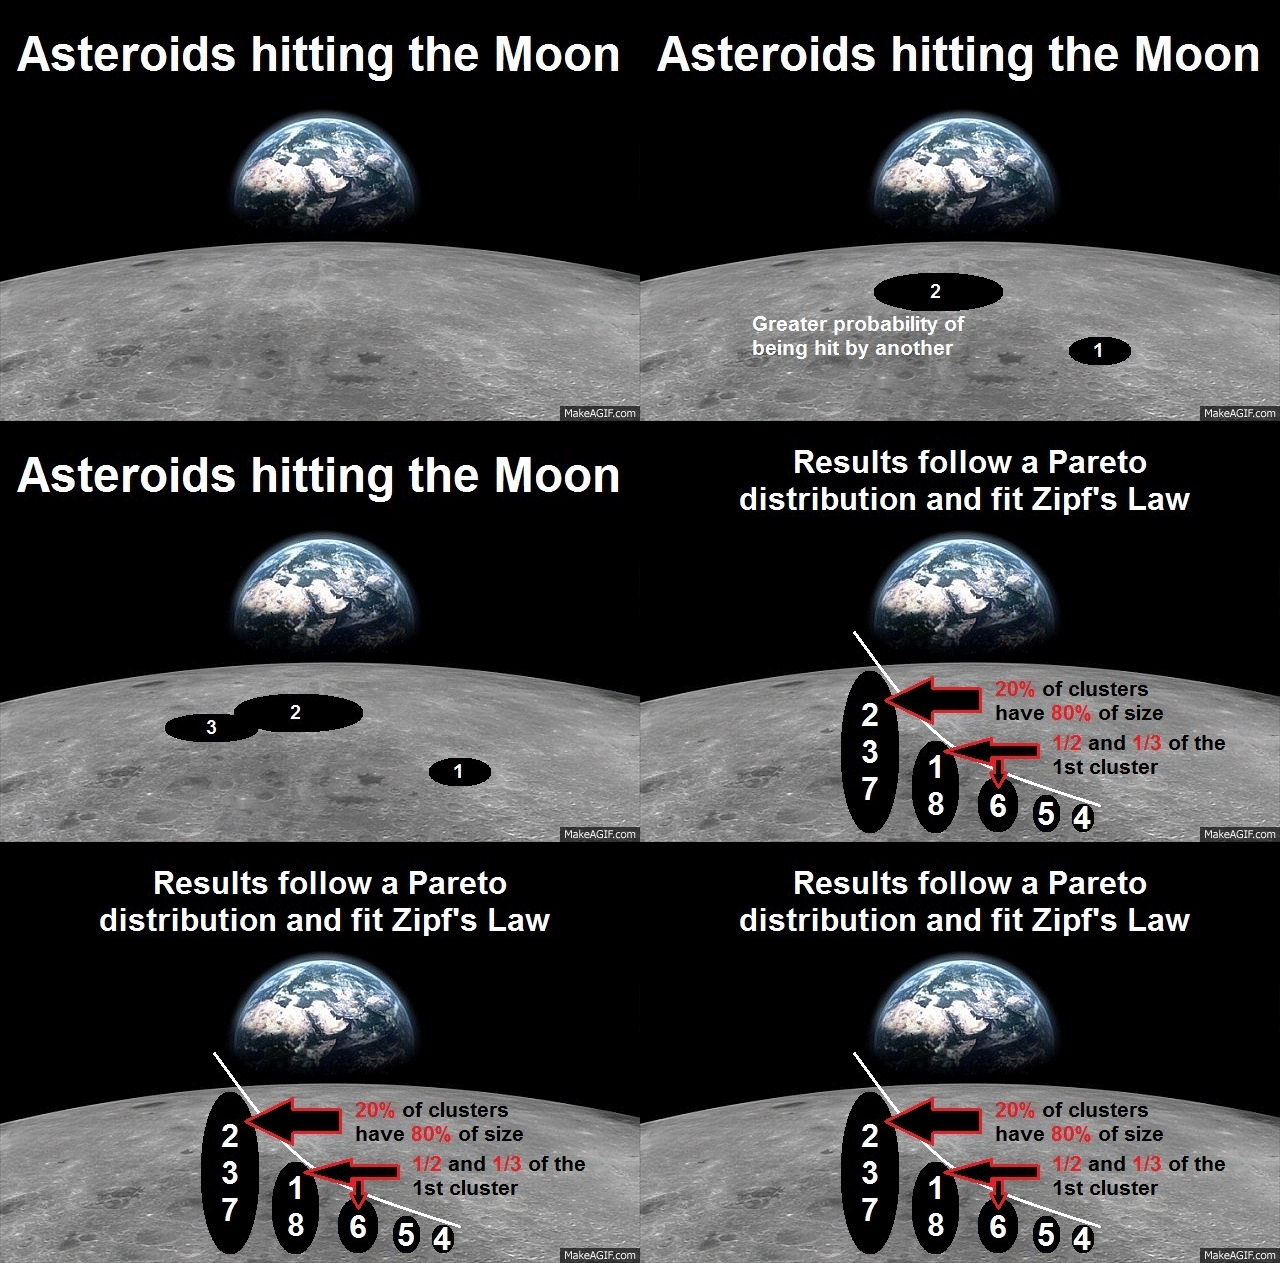
So, imagine if you will, that there is an untouched Moon – a perfectly smooth surface. Now, say there are some randomly sized asteroids that hit the Moon willy-nilly. When the first asteroid lands, it leaves a crater. Now another one hits, leaving a crater elsewhere. Each crater is a part of the total surface area, therefore there is a chance that the next random asteroid will hit close to an existing crater and join with it, forming a group. The chance of a new asteroid hitting a given crater is then proportional to the craters and asteroids existing size. This means that the next random asteroid is more likely to join the largest existing group, making it even larger. A kind of cumulative process, which then creates a rich-get-richer poor-get-lonelier mechanism.
Keep this in mind, because that’s believed to be the general explanation for “why” Zipfs law works with such mysterious universality. The asteroid example is quite simple, however the question is what will happen over many repetitions
A little bewildering?
Well, I made a gif to drive this initial point home. NB! the graph will be discussed later, just try and picture the experiment.

If we observe the actual Moon, it turns out that, as the amount of asteroids increases to large amounts, the crater diameters observed grow such that the top 20% of biggest craters approach 80% of all the surface area.
So as we go to more asteroids, the distribution of most popular to least popular groups approaches some kind of “ideal distribution” with this 20/80 property – a Pareto distribution. If you do the math, it turns out that (in general), if the largest group has size N, the second largest group is around size N/2, the third N/3 and so on and so forth. This is called the Zipf’s Law. The weird thing is Zipf’s Law and Pareto distribution works for a bewildering amount of elements (asteroids) and groups (crater clusters). Of course, there are skews and random disturbances, but the general trend is undeniable.
I hope you can see how asteroids being more likely to hit large craters on the Moon connects to cities being more attractive, if there are already more people living in them. However, one has to realize, cities are far from the only “groups” that behave according to Zipf.
Here are some examples from Mark Newmans research on Pareto distributions. NB! The graphs are in log-log scale which smooths out the hyperbolic form of the curves, presenting a nearly linear relation.
Initial y = aX^(-b)
Logs of both sides => log y = log a – b log X
Interestingly enough, the same trend is also displayed by religious cults… The shared property of most of these phenomenon is simply this “large-groups-get-larger” tendency. So Zipf’s law is persistent in mechanisms, where the preferences of elements is positively connected to the groups size (meaning, the larger the group, the more likely it will grow). This is why I like to think of groups as clusters and elements as cluster-ers.


Zipf’s Law in Steam markets
Suspicious of that last one? Here is the amount of time people spend on the most popular games on Steam.. Data from SteamSpy.

If you do the math, it turns out that 20% of most popular Steam games account for 80% of the total amount of playing, so the Pareto 20/80 mystery works like a charm here… One must notice, however that for Zipf to be true, CS:GO needs to account for 37,5%/2 = 18,8% of total time instead of a whopping 30%. But aside from this outlier (STOP PLAYING CS:GO), the Zipf-like distribution is clearly there.
Here is the amount of copies sold for the most popular games.

Looks much nicer eh? Copies sold does not have large outliers so it fits very well, which is a noteworthy difference. However, there is something more interesting to conclude from the differences of the last two graphs.
Do you notice how the “tail” going to the right is kind of fat in the second graph? Well, in simple terms, this tells us that the “relatively unpopular” games are actually quite a lot more popular than in the previous plot.
In fact, it turns out that 20% of most popular games account for only 60% of sales, versus 80% of playing. Interesting? You bet your ass it is.
What can we learn about Steam?
Well, the fact that game popularity follows Pareto distribution tell’s us that, indeed there is some kind of a positive Network effect, which makes players choose games which are already being played by more people. What the difference in fatness of tails tells us is that Steam users are a lot more “group-size-blind”, when buying games than they are when they play them.
Think about it – the more people buy games regardless of the “current popular opinion”, the more flattened out the Pareto distribution gets, as it is less likely for large games to grow further. If nobody gave a rats butt about how many people already play a game and the availability of all games was the same, then we would expect 20% of most popular games to account for about 50% of sales and playtime (e.g. assuming individual preferences are normally distributed).
Conclusions
So there are two factors that contribute to the Pareto distribution in Steam markets – how innovative the developers are (how many new Moon craters are being formed) and how much the gamers (asteroids) value the current group size, when choosing which group to join. As it turns out, gamers are very group-size-blind when buying games, but just the opposite when they play them. Cool huh?
If you want to learn more about Zipf’s Law and Power Law distributions, here is a nice lecture. Furthermore, be sure to have a look at Newman’s paper!
If you want to read more of this kind of stuff, soon enough I will try to join this observation to a model, which shows that more popular multiplayer games have higher prices (which links to gamers preference to join groups of larger size). See the article here. The Piece De Resistance article will try and join these theories together explaining how multiplayer games, social networks and cities are in fact all anti-rival goods with network effects, (the more people consume a good, the more each individual consumer benefits) which has entitled them with this Zipfian mist of mystery…
Until then – enjoy yourselves!
P.S. Pop in a comment with a fun idea for a 20/80 relation you think might be true.
Mine are:
80% of peoples nostalgia is caused by 20% of their happiest memories (actually proven for the rate people forget information at)
80% of mass is concentrated in 20% of the largest space objects (actually proven for distribution of gravitational force)
And of course
80% of the mess in your toilet comes from 20% of what you eat (no academic research to speak of)


Published: Sep 25, 2015 05:16 pm